WindowsFirewallRuleset
Monitoring Firewall
This document explains how to monitor Windows firewall and network activity on local system.
Note: all of these programs must be run as Administrator:
Table of Contents
- Monitoring Firewall
- Table of Contents
- Monitor your firewall like a pro
- Process Monitor
- mTail
- mTail alternative
- Tailing logs standard alternative
- Event log
- WFP state and filter logs
- Windows Firewall
- TCP View
- netstat
- Packet trace and analysis
- netsh trace
-
[capture=yes no](#captureyesno) - protocol
- traceFile=path/filename
-
[persistent=yes no](#persistentyesno) -
[fileMode=single circular append](#filemodesinglecircularappend) - maxSize
-
[overwrite=yes no](#overwriteyesno)
-
- NetEventPacketCapture
Monitor your firewall like a pro
As you might already know, Windows firewall does not give us any easy to use tools to monitor
what the firewall is doing.
However there are few programs and techniques available to monitor firewall activity in live.
Note that there isn’t an “All in one” solution, an ultimate program that does all the job. instead we have to deal with multiple tools, each specialized for certain purpose, if you’re serious you will need them all.
Some tools are easy to use, some require learning how to use them, some have graphical interface
some are command line programs.
Some tools do the same job as other tools but complement missing features of other programs,
while having other drawbacks.
For each program listed here you have a reference link (for tools built into Windows) and download link (for external programs).
All of the tools listed here are digitally signed, the only exceptions are as follows:
-
mTail, to mark mTail as trusted you can verify it’s behavior with process monitor or check it’s user base online.
-
An alternative for mTail (described later) is a combination of VSCode extensions and predefined extension settings.
Process Monitor
- Process monitor will let you monitor process network activity, in addition to IP address and port you will also know which process and which user (either system or human user) initiated connection, and several other stuff which you can enable as needed in options.
- Process monitor is must have program, here is a screenshot while monitoring process network activity:
click on image to enlarge!

- Inside the
Config\procmondirectory you will find process monitor configuration specialized for firewall monitoring which you can import into your copy of process monitor. - Note that this configuration filters some network traffic which you might not want to see, click on filter button (or menu) to disable specific filters or to add new ones.
mTail
- mTail is another useful (easy to use) program, it will let you monitor firewall logs in real time.
- Here is a screenshot while monitoring logs, click on image to enlarge:
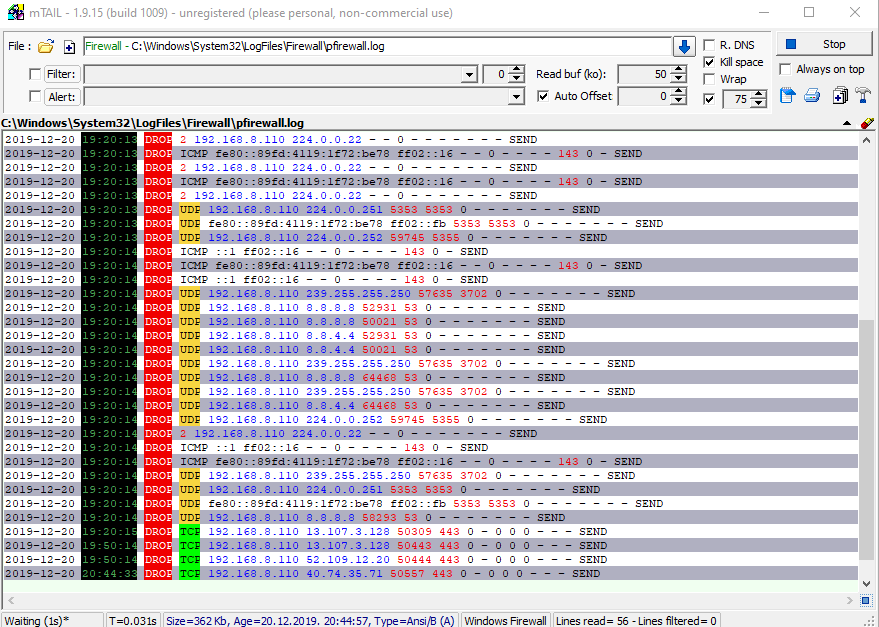
- Default mTail does not have special firewall coloring, those colors you see in the screenshot are
custom made, you can get this configuration from
Config\mTaildirectory in repository, the config file is namedmtail_CC.ini, just place it next to mTail executable, restart mTail and open firewall log, which is by default placed intoC:\Windows\System32\LogFiles\Firewall\pfirewall.log\HoweverComplete-Firewall.ps1script will instruct firewall to write separate logs for each firewall profile. - There is another config file called
mtail.iniwhich first need to be edited to update hardcoded paths and then (re)placed into:C:\Users\ADMINUSERNAME\Roaming\mtail\, this config file contains configuration to monitor firewall activity for individual firewall profiles as well as number of personalized settings. - Please keep in mind that settings configuration for mTail is (at this time) highly buggy, and requires hacking configuration files.
mTail alternative
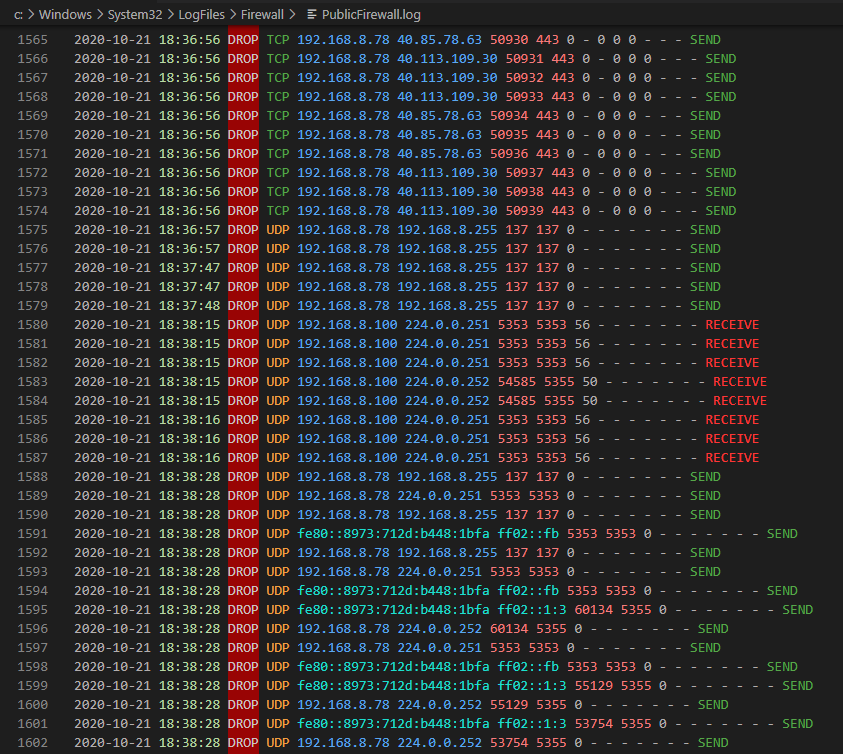
- Repository settings include extension recommendations and settings as an alternative for mTail, here is how it feels in VSCode.
- Prerequisites and setup for built-in log tailing are as follows:
- Accept and install recommended workspace extentions for VSCode
- Modify variable
FirewallLogsFolderinConfig\ProjectSettings.ps1to value$LogsFolder\Firewall - Ensure variable
DefaultUserpoints to your account username inConfig\ProjectSettings.ps1 - To apply this setting restart PowerShell then run
Scripts\Complete-Firewall.ps1and reboot system - Next step is to grant appropriate file system permissions to firewall logs which are now written
toLogs\Firewalldirectory in repository, but before doing this ensure specified location as
well as log files have been generated, if there are no log file see FAQ to resolve the issue. - To grant permissions for your account and firewall service run
Scripts\Grant-Logs.ps1 YOUR_USERNAME
Permission is valid until system reboot, any firewall setting change or manual permission removal. - In VSCode open individual firewall log file under
Logs\Firewallnode - To filter log contents open command palette
CTRL + SHIFT + P, type “Filter line by Config File” and press enter. - This action will create additional (filtered) log file in same directory called
FILENAME.filterline.log - Config file is located inside
.vscode\filterline.jsonand supports regex to fine tune your filter. - For sample filterline regexes take a look into
docs\Regex.md
Tailing logs standard alternative
Yet another standard and quick way to monitor logs is with PowerShell commands, ex:
Get-Content "%SystemRoot%\System32\LogFiles\Firewall\pfirewall.log" -Last 10 -Wait | Select-String "DROP"
Event log
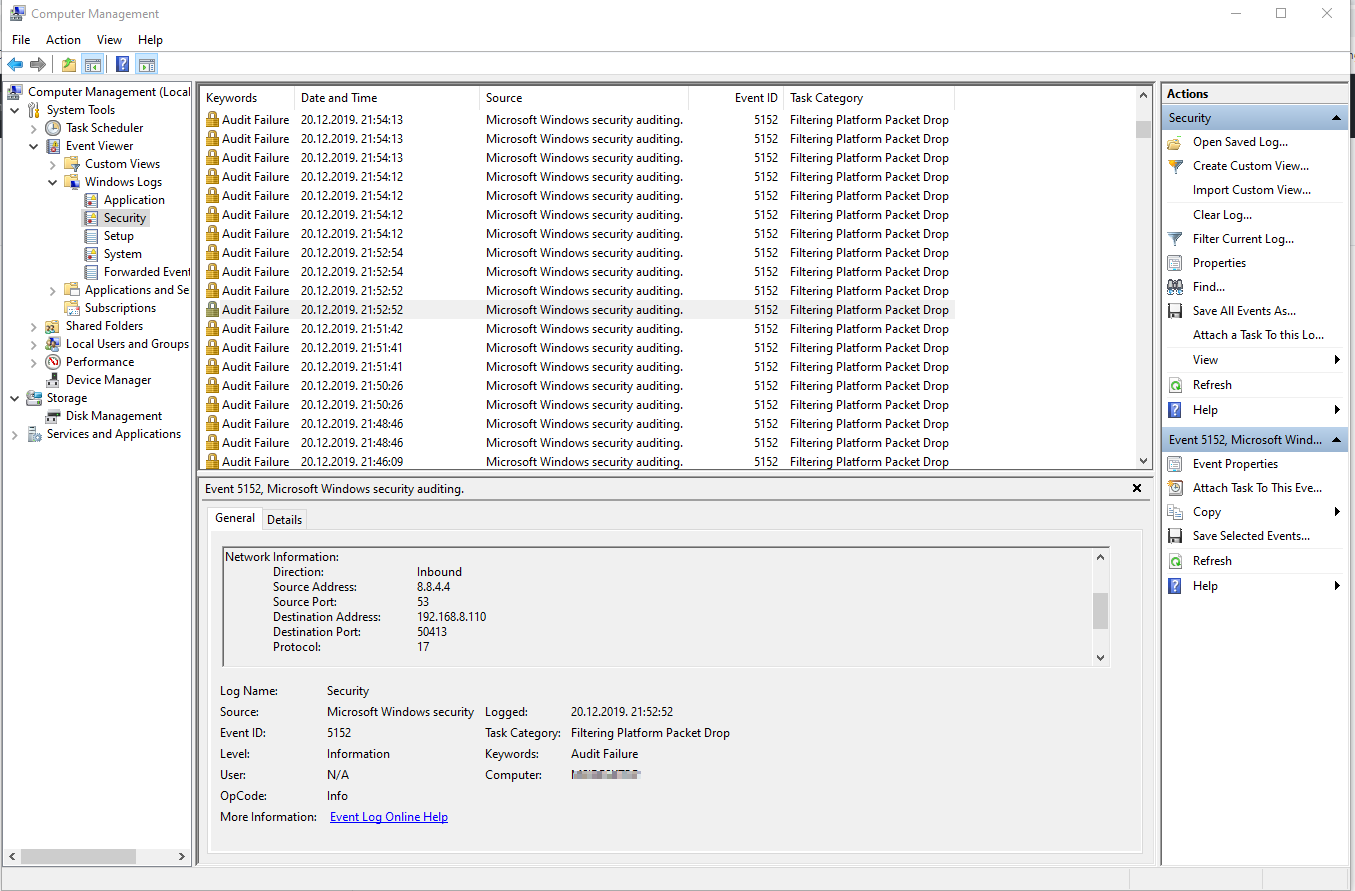
- Event viewer is built into Windows, it will tell you specific stuff that no other program can,
for example with this tool you can see inbound traffic passing or hitting firewall from WAN. - Note that most of data you will see isn’t available in firewall logs (even if you enable “log ignored packets”), why is that so? I don’t know, maybe we should ask Microsoft, anyway, at least here is how to gain this hidden firewall information.
- Here is sample screenshot, click on image to enlarge:
- To enable packet filter monitoring with event viewer you need to enable auditing option as follows:
- Click on start and type:
secpol.msc, right click and “Run as Administrator” - If prompted for password, enter administrator password and click “Yes” to continue
- Expand node: “Advanced Audit Policy Configuration”
- Expand node: “System Audit Policies - Local Group Policy Object”
- Click on “Object Access”
- Double click “Audit Filtering Platform Packet drop”
- Check “Configure the following audit events”
- Check “Failure” and click OK to apply
- “Audit Filtering Platform Connection” (this is optional, it’s not recommend to enable this to
reduce amount of data,
and to focus on relevant, which is monitoring dropped packets)
To open Event viewer to monitor configured packet filtering events follow steps below:
- Click on start and type:
compmgmt.msc, right click and “Run as Administrator” - If prompted for password, enter administrator password and click “Yes” to continue
- Expand node: “Computer Management (Local)
- Expand node: “System Tools”
- Expand node: “Event Viewer”
- Expand node: “Windows Logs”
- Click on “Security”
- In the column “Task Category” look for “Filtering Platform Packet Drop”
- Click on individual event to see details about the event
WFP state and filter logs
Are you unable to figure out why your rules don’t work and why packets are dropped?
If so here is another powerful tool which will let you gather more information about specific
firewall event.
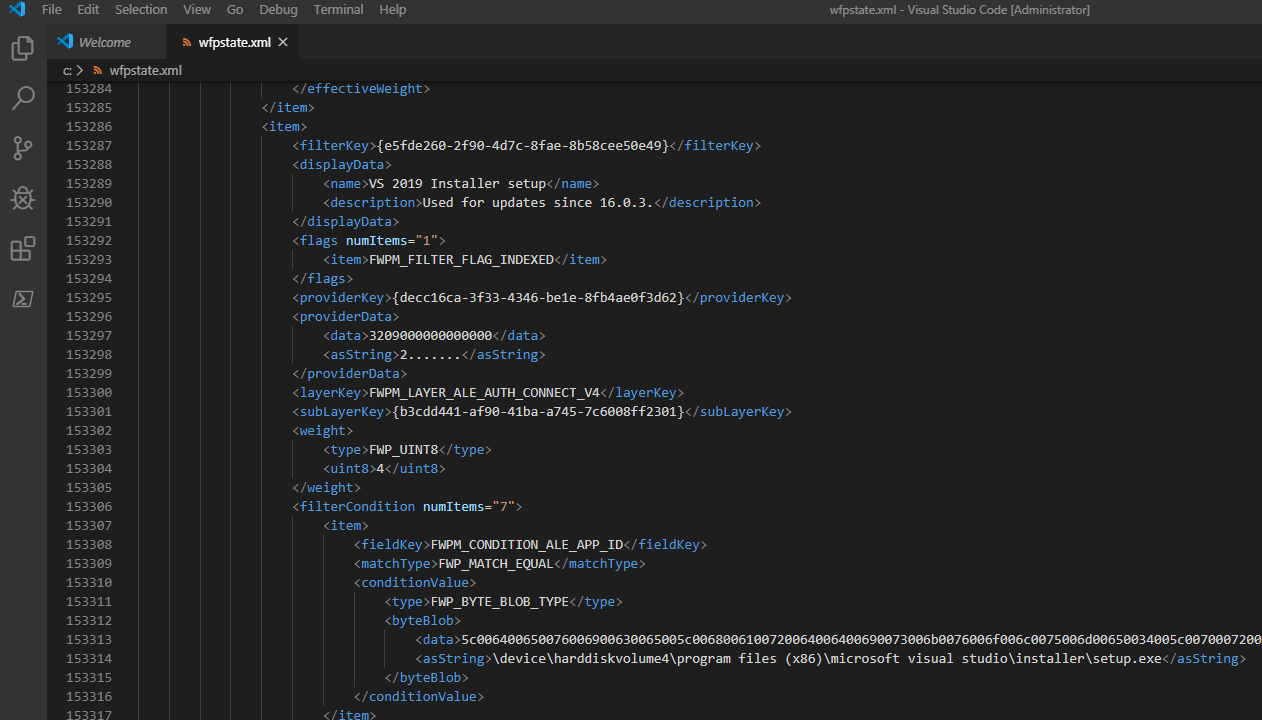
click on image to enlarge:

- WFP stand for “Windows Filtering Platform”, native packet filter upon which Windows firewall is built.
- NOTE: you need to enable at a minimum, auditing of dropped packet as explained in the section “Event log” above.
- You can access WFP logs, filter and state by executing the following commands:
netsh wfp show stateto show current state, such as detailed information about dropped or allowed network packets.netsh wfp show filtersto show current firewall filters (filters define firewall rules, rules by themself are just high level representation) - When you execute show state, it will generate xml file in the same directory where you execute command, open this file with your code editor such VS Code.
- What you are looking for here is an ID called “Filter Run-Time ID” and “Layer Run-Time ID”, you can obtain these ID’s from event viewer as shown in Event log (screenshot above).
- Find and copy desired “Filter Run-Time ID” number in event log, press CTRL + C to copy, go to VS Code,
open generatedwfpstate.xmlfile, then press CTRL + F to open “find box” and CTRL + V to paste the number, and hit enter to jump to this event. - “Filter Run-Time ID” and all of the event data is located inside
<item></item>node - Inside this “item” you are looking for
<displayData></displayData>node which will tell what caused the drop, this will be the name of a firewall rule or default firewall action such as default action or boot time filter. - If the cause was default firewall action such as “Default Outbound” which means there is no rule to allow this traffic, take a look back into event viewer to see which application initiated this traffic, as well as what ports and addresses were used, then verify you have firewall rule for this.
- The
<layerKey></layerKey>key will tell you which WFP filter caused the drop, for example the valueFWPM_LAYER_ALE_AUTH_CONNECT_V4means IPv4 authorizing connect requests for outgoing connection, based on the first packet sent. Which btw. tells us there was no adequate allow rule so the default outbound action was hit. -
For detailed information on how to interpret WFP log see “Firewall” section in
docs\Reference.md - WFP Reference
- WFP Auditing reference
- Audit Filtering Platform Connection
- Audit Filtering Platform Packet Drop
Windows Firewall
And of course we have Windows firewall.
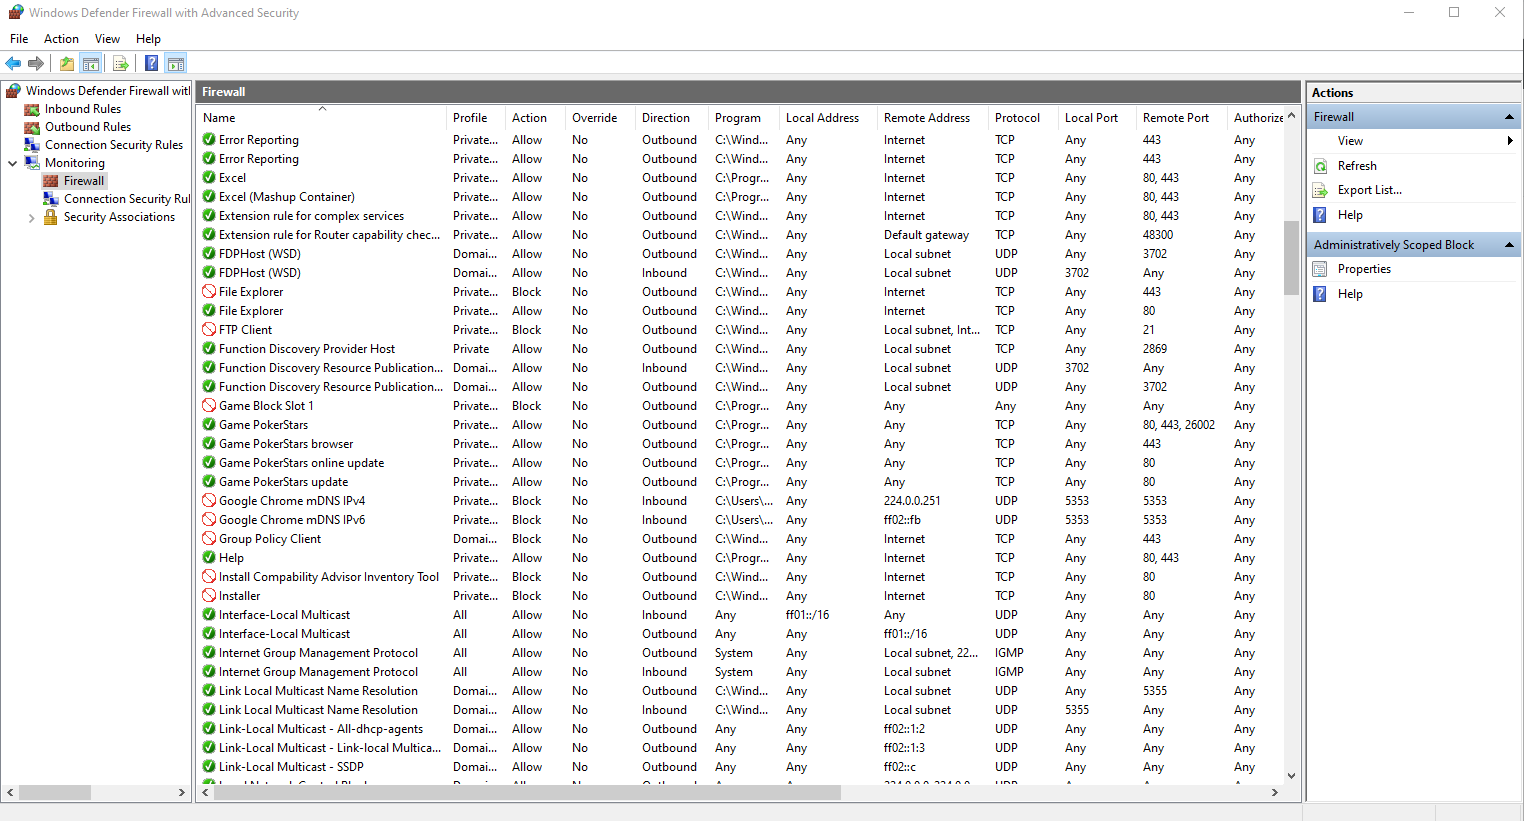
- The firewall GUI will let you see and manage all of your active rules in a user friendly way, you can access either GPO firewall interface, (which is where this project loads rules) or open up firewall interface from control panel.
- The difference is that GPO firewall has precedence over the firewall in control panel, (GPO store vs Persistent store, combined = Active Store)
- btw. Other documents in this repository will give you a reference and explain more about these stores and what they are.
- Another difference is that only in firewall from control panel you can see inbound and outbound rules combined (aka. monitoring)
- One major benefit for firewall monitoring is to generate log files which we can then be filtered
- Here is a screenshot on how to monitor the Active store, click on image to enlarge:
Monitoring: (control panel firewall, Active store)
Management (Local group policy, GPO store)
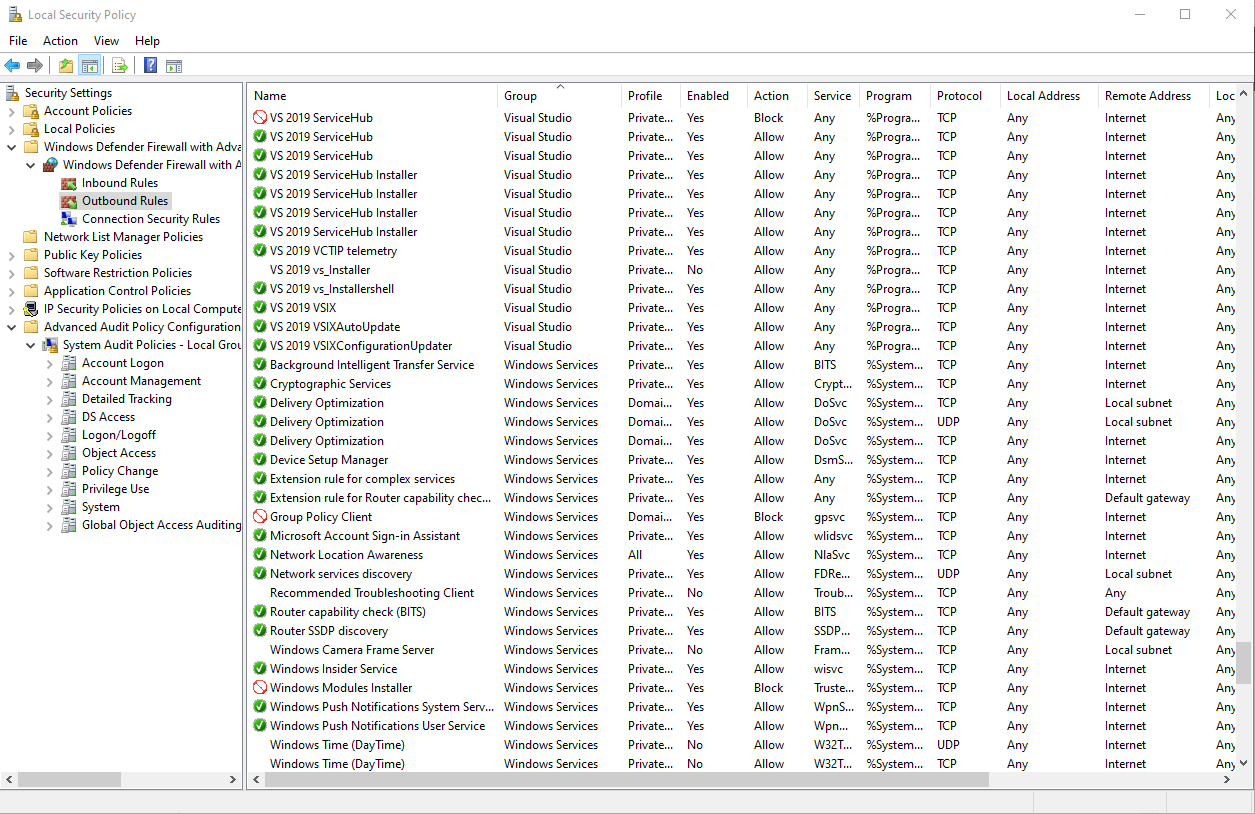
To open GPO firewall follow steps below:
- Press Windows key and type:
secpol.msc - Right click on
secpol.mscand clickRun as administrator - If prompted for password, enter administrator password and click “Yes” to continue
- Expand node:
Windows Defender Firewall with Advanced Security - Expand node:
Windows Defender Firewall with Advanced Security - Local Group Policy Object - Click on either
Inbound,OutboundorWindows Defender Firewall...node
When you open GPO firewall first thing you should do is add columns that are by default not visible and remove those which are useless and only waste space, for example add:
- Service
- InterfaceType
- Edge Traversal
Inside Config\System there is a Firewall.msc settings file, which saves you from doing these
things every time you open GPO firewall, you can customize it and re-save your preferences.
TCP View
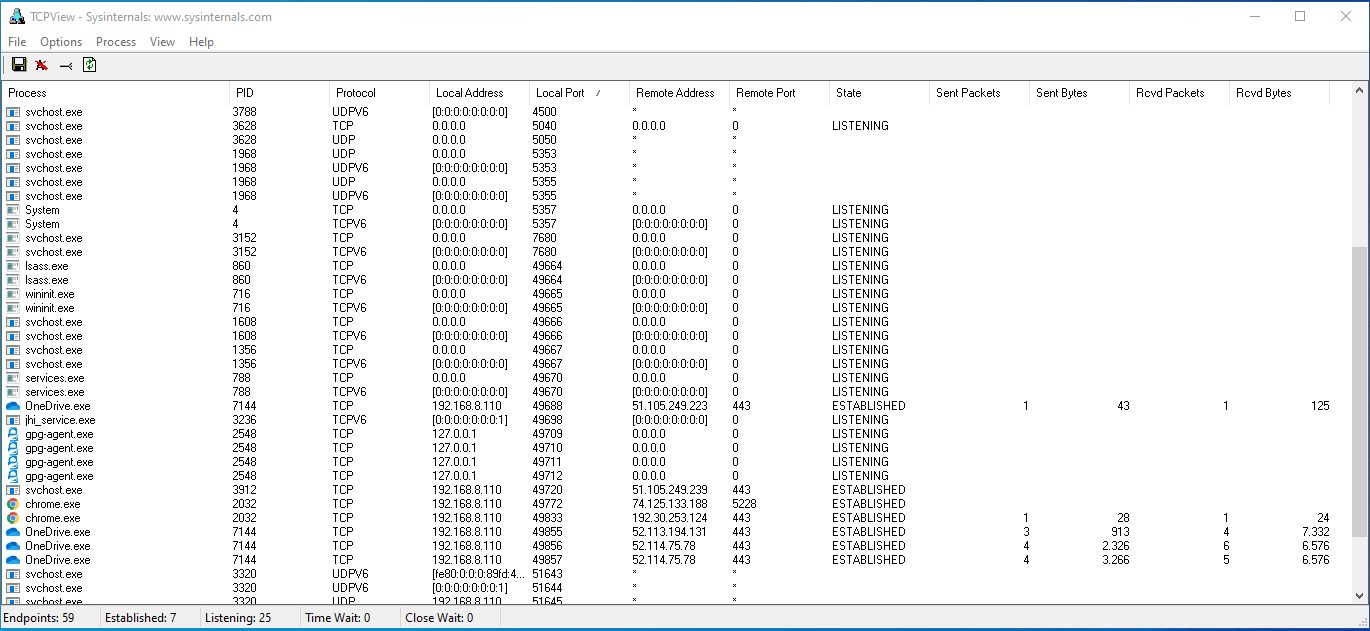
TCP view is another tool that wil let you see which programs are listening on which ports on local system
netstat
- Netstat is another tool built into Windows that does the same job as TCP view, but unlike TCP View it will give you information that isn’t available in TCP View, such as which service is involved in connection.
- ie. useful to discover listening UDP related windows services or to show icmp statistics
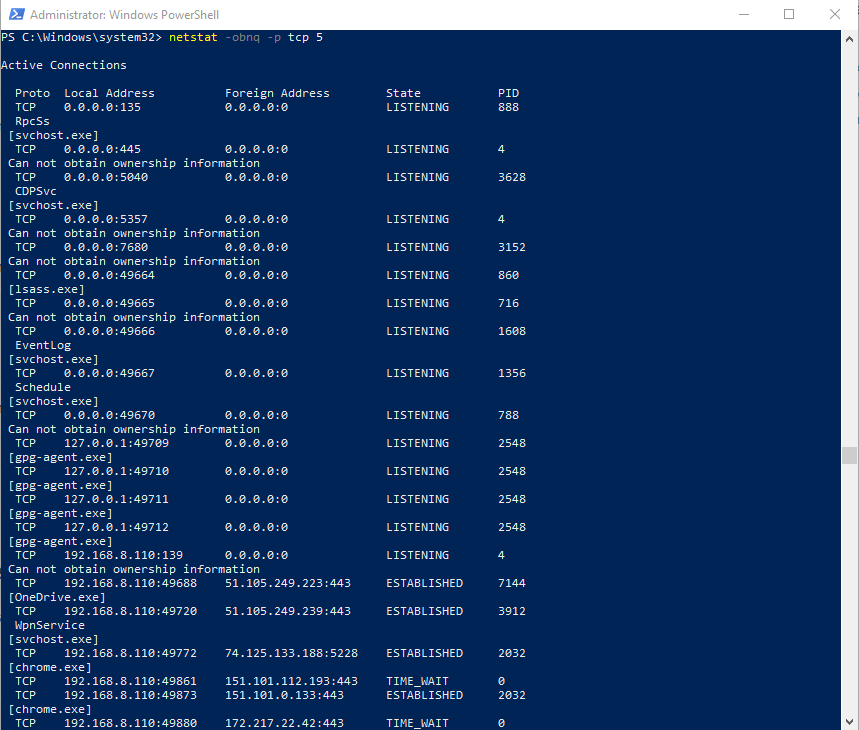
A few useful commands are as follows:
Show all TCP connections and executables involved
netstat -obnq -p tcp
Show ICMP statistics:
netstat -s -p icmp
Packet trace and analysis
In some special scenarios you might want to have much more power than what you have with firewall logs.
For example if you want to see ICMP traffic one way is to set firewall to log both allowed and
dropped packets and then filter logs as needed, (ex. with filterline extension)
Other times you might want to analyse firewall or network performance.
To handle these and similar scenarios there is network capture and tracing solution.
To view and analyse an *.etl file you’ll need to install “Windows Performance Analyzer” which
is availabe as an optional installment of Windows 10 SDK or Windows ADK
Once you install it and open ETL (Event Trace Log) file here is sample traffic analysis screenshot:
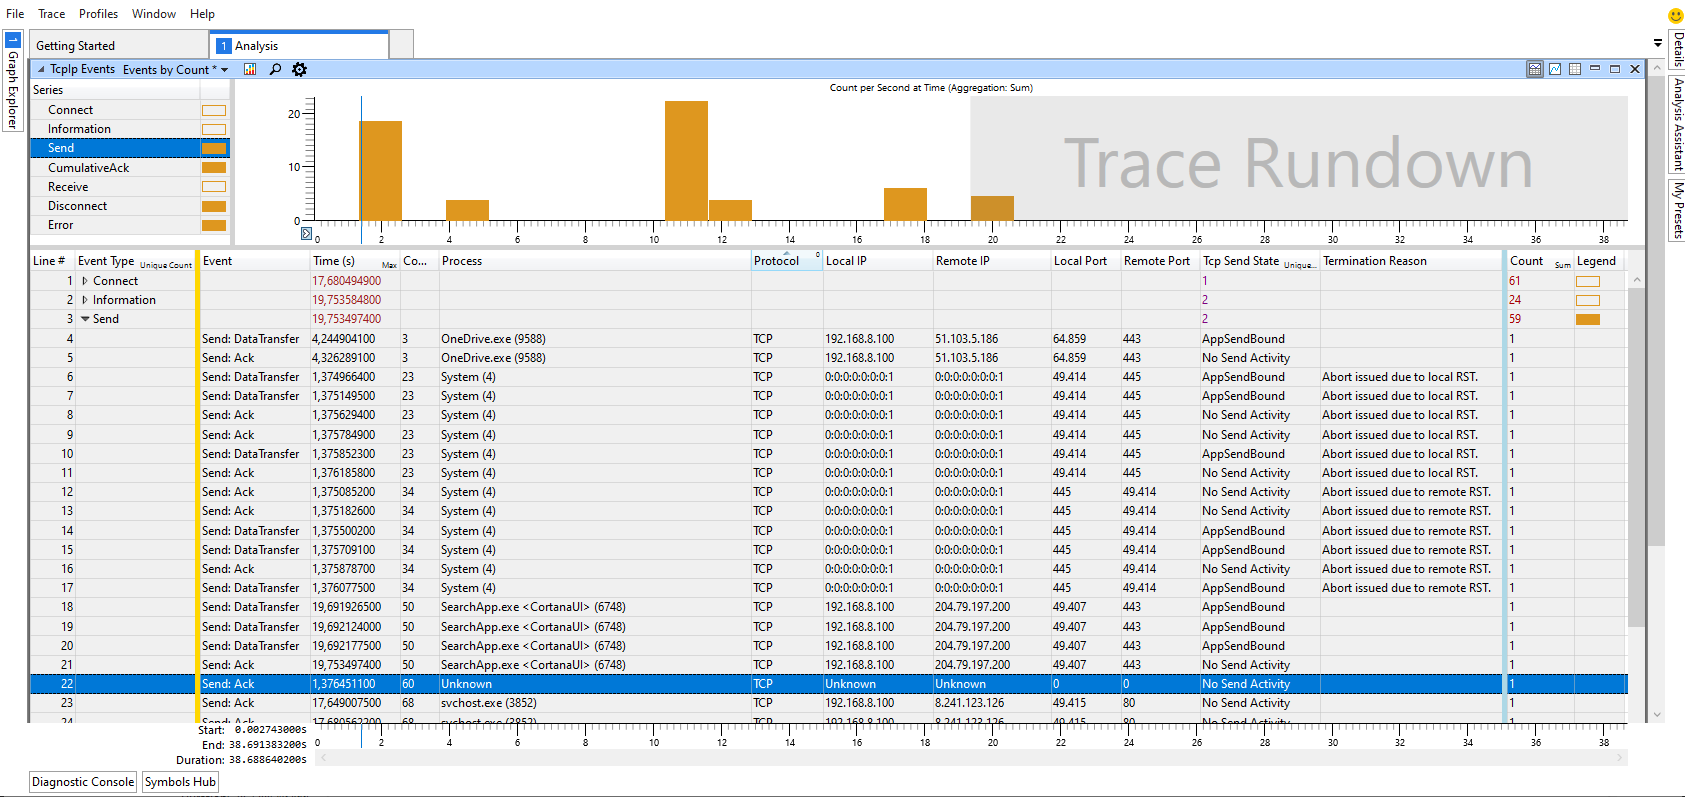
To generate an ETL file use “Windows Performance Recorder” which is part of same package in either Windows SDK or Windows ADK.
Other two (less useful) methods are described in two sections that follow in this guide.
netsh trace
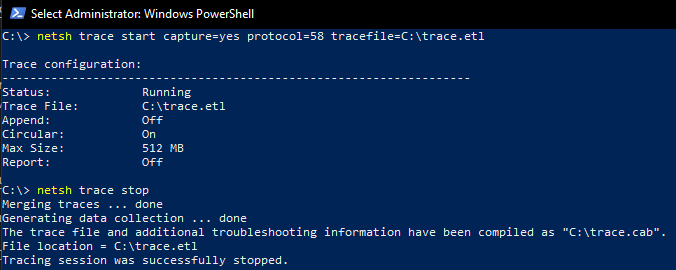
netsh trace option is similar to capturing “WFP state” and “Packet analysis” discused before.
There is no benefit to use this legacy program.
Here are few examples for netsh trace start
Capture UDP traffic where source or destination IP matches IPv4.Address value
netsh trace start capture=yes Ethernet.Type=IPv4 IPv4.Address=192.168.33.33 protocol=17 tracefile=c:\temp\trace.etl
Capture only ICMPv6 traffic
netsh trace start capture=yes protocol=58 tracefile=c:\temp\trace.etl
Capture all network traffic on a specific Network Interface and stop when capture file grows to 300 MB
netsh trace start capture=yes tracefile=c:\temp\trace.etl CaptureInterface="Ethernet interface" maxSize=300
To view status after running netsh trace run:
netsh trace show status
To stop tracing run:
netsh trace stop
For more information run:
netsh trace show capturefilterHelp
The meaning of options is as follows:
capture=yes|no
Specifies whether packet capturing is enabled in addition to tracing events.
The default is no
protocol
Specifies IP protocol for which to trace or capture traffic.
For valid values and their meaning see: Assigned Internet Protocol Numbers
traceFile=path/filename
Specifies the location and file name where to save the output.
The default is: %LOCALAPPDATA%\Temp\NetTraces\NetTrace.etl
persistent=yes|no
Specifies whether the tracing session resumes upon restarting the computer.
The default is no
fileMode=single|circular|append
Specifies which file mode is applied when tracing output is generated.
The meaning of options (probably) is as follows:
singleOverwrite existing file and fill it with up tomaxSizevaluecircularDiscard older entries to make space for new ones oncemaxSizeis reachedappendAppend to file up tomaxSizevalue
The default is circular
maxSize
Specifies maximum log file size in MB (Mega Bytes).\
To specify the maxSize=0, you must also specify filemode=single
If the value is set to 0, then there is no maximum.`
The default value is 250.
overwrite=yes|no
Specifies whether an existing trace output file will be overwritten.
If parameter traceFile is not specified, then the default location and filename and any pre-existing version of the trace file is automatically overwritten.
NetEventPacketCapture
NetEventPacketCapture is a PowerShell module that is a replacement for netsh trace
Almost everything netsh trace can do can be also done with NetEventPacketCapture module.
Inside Scripts\Experiment directory there are experimental Start-PacketTrace.ps1 and Stop-PacketTrace.ps1
scripts which make use of NetEventPacketCapture module, you can use them to quickly start and stop
packet capture.
Keep in mind that both the netsh trace and NetEventPacketCapture generate an ETL file
(Event Trace Log), problem in both cases is the lack of executable involved in traffic.
This problem can be solved with “Windows Performance Recorder” which generates required symbols.